You may not know this but Google is constantly adjusting their algorithms to provide users with the best possible search experience. You may hear see news stories about Google pushing a ‘major update.’ This is a pain for digital marketers, but as a consumer, I’m OK with it. I want to view the best information.
One of the factors they are circling in on for next year is called Core Web Vitals. Core Web Vitals are quantifiable and measurable performance factors that affect a user’s experience on your website. Simply put, how fast does your web page load? In May 2020, Google announced a major algorithm change expected in 2021 that will be using these core web vitals to rank websites. More and more, they are looking at user experience on the web. So what is involved with getting your Core Web Vitals up to speed? Let’s jump in.
Every Second Counts
Have you ever been frustrated as a webpage takes forever to load, only to smash that BACK button and go to the next search result? Page speed affects bounce rate and shopping behavior in a big way. Bounce rate, a statistic you can view in Google Analytics, is the percentage of users on a particular website who navigate away from the site after viewing only one page. A high bounce rate can be the sign of deeper issues with your website, such as poor user experience or poor audience targeting.
Let’s take a look at the numbers:
- 40% of consumers will abandon a web page that takes more than 3 seconds to load.
- If a website takes 10 seconds to load, the probability of a user bouncing increases by 123%.
- Ancestory.com improved the render time of web pages by 68%, reduced page bloat by 46%, and load time by 64% which resulted in a 7% rise in conversions.
- A Google Study of over millions of page impressions finds that when a website meets the recommended thresholds for Core Web Vitals metrics, users are at least 24 less likely to abandon a page before it finishes loading.
Think about it from a user’s perspective; you don’t want to wait a long time for a web page to load. It is frustrating going from page to page and having difficulty getting the information you need. Google knows this as well! When you go ‘back’ to the search engine results page on Google before the page is done loading and click through to another search result, Google assumes that you did not find the right information.
Now that we know how this affects user behavior, how we can access this information?
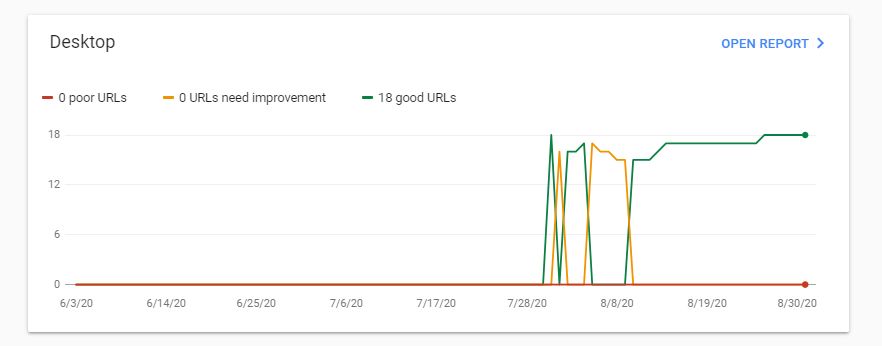
You can find information on the Google Search Console, underneath the Enhancements section. Google Search Console is an crucial addition to find out how your website is doing within Google Search. The information pairs well with Google Analytics. If you aren’t set up with Google Search Console, it’s important to get set up ASAP, because they will only start showing you information from the point when you installed GSC. If you need assistance getting set up with Search Console or Google Analytics, contact our team and we can help you.
You can also get an analysis of PageSpeed Insights from inside Google Chrome or by visiting PageSpeed Insights.
Now, what can we do about this? First, let’s define the Core Web Vitals that Google is looking for.
Core Web Vitals
These are the quantifiable metrics that Google takes into count for ranking signals.
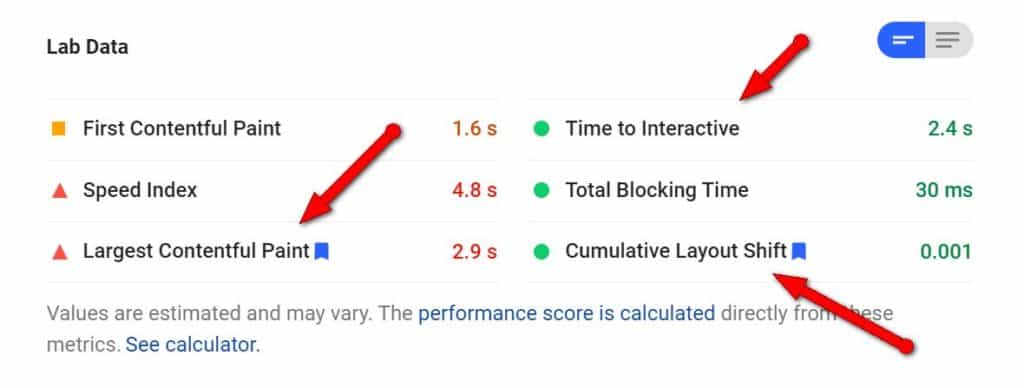
Loading Time: (referred to as LCP or largest contentful paint): The amount of time to render the largest content element visible in the viewport when a user requests the URL. This is usually an image or video file, and this is important because it tells the user that the webpage is actually loading.
Interactivity: (referred to as FID or first input delay): The time from when a user first interacts with your page (by clicking a link, tapping a button, etc) to the time when the browser responds to that interaction. This is important, because at this point, the page has become interactive and available for the user to interact with it.
Visual Stability: (referred to as CLS or cumulative layout shift): The amount that the page layout shifts during the loading phase. This is scored between 0-1, with 0 being no shifting and 1 being the most shifting. This is important, because when a webpage has elements that shift as it is loading, the user won’t be able to focus on the element or information that they are trying to access.
Other Web Vitals that Affect Page Experience
These vitals are important to a user’s experience as well, but are not related to Pagespeed. They are worth mentioning, as some websites still struggle to fulfill these.
Is your website mobile friendly? Google measures this within Google Search Console.
Is your website safe to browse? Is it free of malware and spyware?
Is your website being served over a secure connection? Check for the lock or an https:// vs. an http:// URL.
Are there popup ads on your website? Google defines these as “Intrusive Interstitials.”
What Actions Can I Take to Improve Core Web Vitals?
You must know where you started to get to where you want to be!
When I first look at a website, I will input it into GTMetrix.com to get the baseline before optimizing it. I use GTMetrix over PageSpeed Insights, because will give a more technical look at how to fix performance issues on a website and you can keep tabs and check progress over time. GTMetrix will give you a waterfall view of what resources are being loaded on the website. With that, we can pinpoint what resources are taking the most time to load. I look at 3 metrics on GTMetrix: Fully Loaded Time, Total Page Size, and Requests
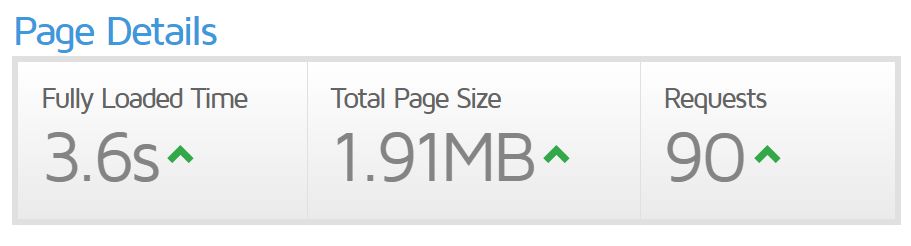
All of these should be as low as possible! Let’s look at some of the low hanging fruit that inhibits the performance of website.
As with any tool that is a robot crawler, whether that is GTMetrix or PageSpeed Insights, you should sometimes take the information with a grain of salt. Remember to optimize for a human’s experience, not the robots. We can’t let the robots win. Now onto some ways to optimize.
Optimize and Compress Your Images
The most common problem I see on websites are unoptimized images. The images are unnecessarily large in size and this problem has exponential returns. If you are forcing users to load large files, not only are you putting additional strain on their data plans, but you are putting additional bandwidth strains on your own hosting server. Modern technology allows us to have compressed images with the same quality to the human eye.
You can use programs like RIOT for PC or ImageOptim for Mac. All of our Care Plan customers using WordPress sites utilize the plugin ShortPixel, which will automatically optimize an image after it is uploaded, regardless of who the user is. This guarantees that images on your website will always be optimized.
Serve Scaled Images
In simple terms, your website should be showing the correct sized pixel image right off the bat, before sizing it down to your browser. What’s the point of having a 1200×1200 logo if the browser is rendering it down at 200×200? That is wasted resources.
In WordPress, we utilize ShortPixel Adaptive Images with our Care Plan customers to take care of this. Regardless of if a user is shown a website on desktop, tablet, or mobile, they will see the correctly sized image.
Reduce the Number of Requests
When a website loads, it loads from many different scripts and elements to create the page that you see on your device. With every script and element comes more resources that are required to load the page properly. If you use Chatbots, tracking pixels, Hubspot integrations, Google Fonts, Adobe Typekit, or Font Awesome Icons, you will be pulling in scripts from outside resources and relying on them to be fast.
Requests are important to the functionality of your website. Try to keep these to minimum.
Get Rid of Slow Plugins
Not all plugins will negatively affect your page speed, but a lot do. Each plugin has its own scripts and elements to allow it to run. By using one plugin to cover multiple uses, you can reduce the number of requests and scripts that your website needs to load. For example, we use Elementor to build our websites, because it gives us the ability to create forms, add website animations, add image lightbox capability, and more.
Over the years, we have developed a “stack” of plugins to use on every site we build that allows businesses to get the most functionality with the best performance.
Evaluate your Hosting Server
Sometimes you can optimize a web page so much, but if the pages are being served by a slow web host, it doesn’t matter. One metric to look at is the TTFB or “Time to First Byte.” This is a measurement used to determine the responsiveness of a web server. It is literally how many milliseconds for your web browser to receive information from the web server.
We steer our clients away from big box hosts like GoDaddy and EIG web hosts, whose quality has greatly deteriorated over the years. Web hosts we recommend include Kinsta, WPEngine, and Dreamhost. While you don’t want to be migrating your web site to a different web server year after year to get the best performance, it is worthwhile to take a look at how your website is performing before making the decision.
We can help improve your Core Web Vitals.
If you have any questions or need help with improving your core web vitals to improve your overall user experience, reach out to us. We are happy to help!
Resources
Think With Google – Mobile Page Speed New Industry Benchmarks
